Des outils d’analyse de données
pour tous les profils d’investisseurs
Venture Capital & Club Deal
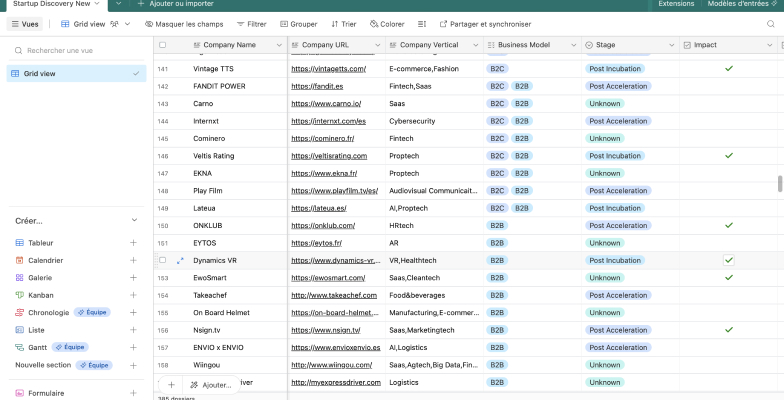
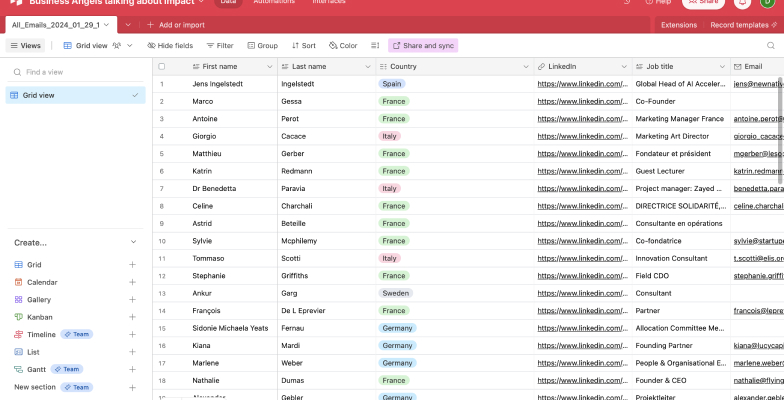
Identifiez des nouveaux LPs ou repérez des nouveaux deals avec nos solutions d’analyse de données qui s’appuient sur l’intelligence artificielle.

Private Equity
Prenez des décisions éclairées en automatisant la création de reporting sur vos cibles et en utilisant la data au service de vos participations.

Family Office
Des outils d’analyse de données conçus pour répondre aux besoins spécifiques des Family Offices, garantissant une gestion efficace et personnalisée du patrimoine de vos clients.

Les bénéfices constatés par nos clients
fois plus d’entreprises détectées
fois moins de coûts liés à la gestion des données
de temps économisé dans la recherche de signaux
des entreprises détectées sont sous le radar
La parole est à nos clients


Parlez de votre projet avec Alexandre !
Analysons ensemble les problématiques liées à la donnée au sein de votre entreprise et profitez d’un accompagnement personnalisé pour répondre au mieux à vos besoins.


Nos ressources